

Identify the right indicators for your ergonomics processes
Determining indicators when embarking on an ergonomic improvement project or, more broadly, a prevention project, is crucial. It is these indicators, these metrics, that enable informed decisions to be made throughout the project. Indicators are also used to determine whether the company is achieving the expected results after optimizing workstations. In other words, it’s best to select them well in advance, so that they are adapted to your objectives and remain relevant over time, from the beginning to the end of the project.
In this article, we’ve put together some tips for identifying the right metrics, with examples of metrics we use daily with our customers. Make your market. 😁
What are metrics, and what’s the point of tracking them throughout a usability project?
Before getting to the heart of the matter, let’s take a quick look at metrics (or indicators). An indicator is a tool used to measure what makes it possible to monitor a project and evaluate its results. It can be :
- Quantitative, based on measurable elements such as a figure, a percentage or a statistic ;
- Qualitative, based on non-quantifiable data, such as questionnaires.
During a workstation optimization project, we use both project and ergonomic indicators (activity indicators), as well as cross-functional indicators, which will also guide us: performance indicators, HR indicators, QVCT (Quality of working life) or more global health and safety metrics.
What are the best indicators for monitoring the progress of your workstation ergonomics project?
There’s no set list of indicators that must be followed for your ergonomics project. Each company draws up its own list, adapted to its business sector, constraints and objectives. It chooses the indicators that will give it a complete overview of its project.
To choose the right metrics, you need to clarify your objectives.
This can be done with the help of the SMART objective’s method, which makes it easier to choose objectives that are relevant to your organization. According to the SMART method, a good objective is :
- Specific ;
- Measurable ;
- Attainable;
- Relevant;
- Time-bound.
For example, halving the number of workplace accidents in the year following workstation optimization is an objective that meets all these conditions.
The list of metrics to drive your ergonomics processes
Here we are. Here are a few examples of the indicators we frequently use for our customers as part of health prevention and workstation improvement projects.
As mentioned above, some are ergonomics process indicators, others are more cross-functional.
Ergonomics and workstation optimization indicators:
- Average cycle time for an operation ;
- Percentage of high-risk/low-risk MSD workstations ;
- Number of workstation optimizations identified ;
- Number of workstations optimized (based on RULA or REBA scores obtained);
- Percentage of workstations optimized ;
- The evolution of the KIMEA score (see next section 😏).
Cross-functional indicators:
- Number of accidents at work ;
- Number of painful recurrences ;
- Number of days off work per employee per year ;
- Absenteeism rate ;
- Number of sick leave over 6 months ;
- Cost of sick leave ;
- Job satisfaction/feeling of hardship ;
- Number of people trained or made aware of MSDs ;
- QVCT index ;
- Number of occupational illnesses ;
- Reclassification rate.
Towards a global ergonomic indicator
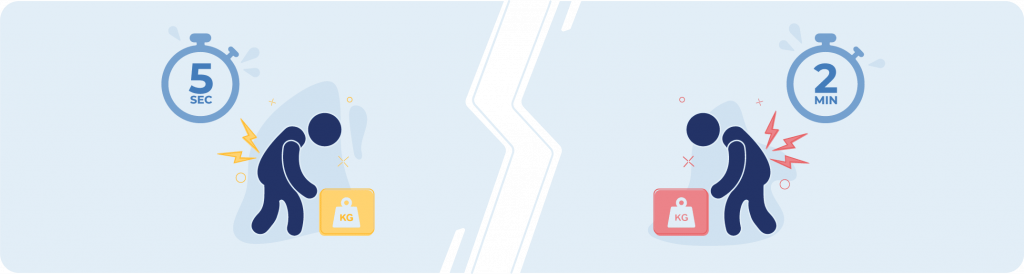
Ergonomists use the RULA and REBA grids to assess the risk of musculoskeletal disorders (MSDs) at a given point in time. Although they provide initial indications, it is not possible to use them to determine the overall evolution of MSD risk while a task. In fact, these grids only provide the intensity of the risk for the posture, and not the length of time the operator is exposed to the risk.
Holding a bad position for five seconds or two minutes will not have the same consequences on a worker’s health!
Very early on, we therefore sought to create our own tool that would give us a more precise view of the risk of MSDs. This tool is KIMEA.
The KIMEA score to facilitate follow-up during your ergonomics project
We created KIMEA to provide our customers with a practical, simple and relevant tool for monitoring their ergonomics process.
KIMEA easily provides quantified information on the risk of musculoskeletal disorders during a movement. Using a motion camera or a smartphone camera, KIMEA models the biomechanical stresses exerted on operators’ joints.
What’s innovative about KIMEA is that it considers the evolution of the intensity and duration of exposure to the risk of MSDs over the whole of the task filmed.
How does it work? KIMEA produces a score between 0 and 100 (0 being the best possible score, with zero risk of MSD and zero arduousness, and 100 being the worst possible score). This score is used to monitor the improvement of workstations throughout the project.
Even people with no training in ergonomics or prevention can get to grips with the tool, making these workstation optimization projects easier to initiate internally.